
01
Interception points are obvious.
When new features land on a diagram of the existing system, scoping conversations happen against a shared picture. Stakeholders see exactly where the change touches and what depends on it.
An end-to-end visual map of your business process, with the underlying Salesforce automation overlaid on the same diagram. One artifact — replacing the documentation that lives in five places — kept current as the org evolves.
Standard Salesforce documentation lives in silos: a process diagram in one tool, a list of Flows in setup, an integration map in a Confluence page no one updates. Each is partial. Together they don't compose into a thing anyone can reason about.
A System Map combines them. The business process — leads, opportunities, orders, whatever your org actually does — runs along the diagram. The automation that drives each transition is overlaid on top: which Flow fires here, which Apex trigger runs there, which integration syncs to which downstream system.
The result is one artifact that stakeholders, admins, and developers can all read against — and decide on.
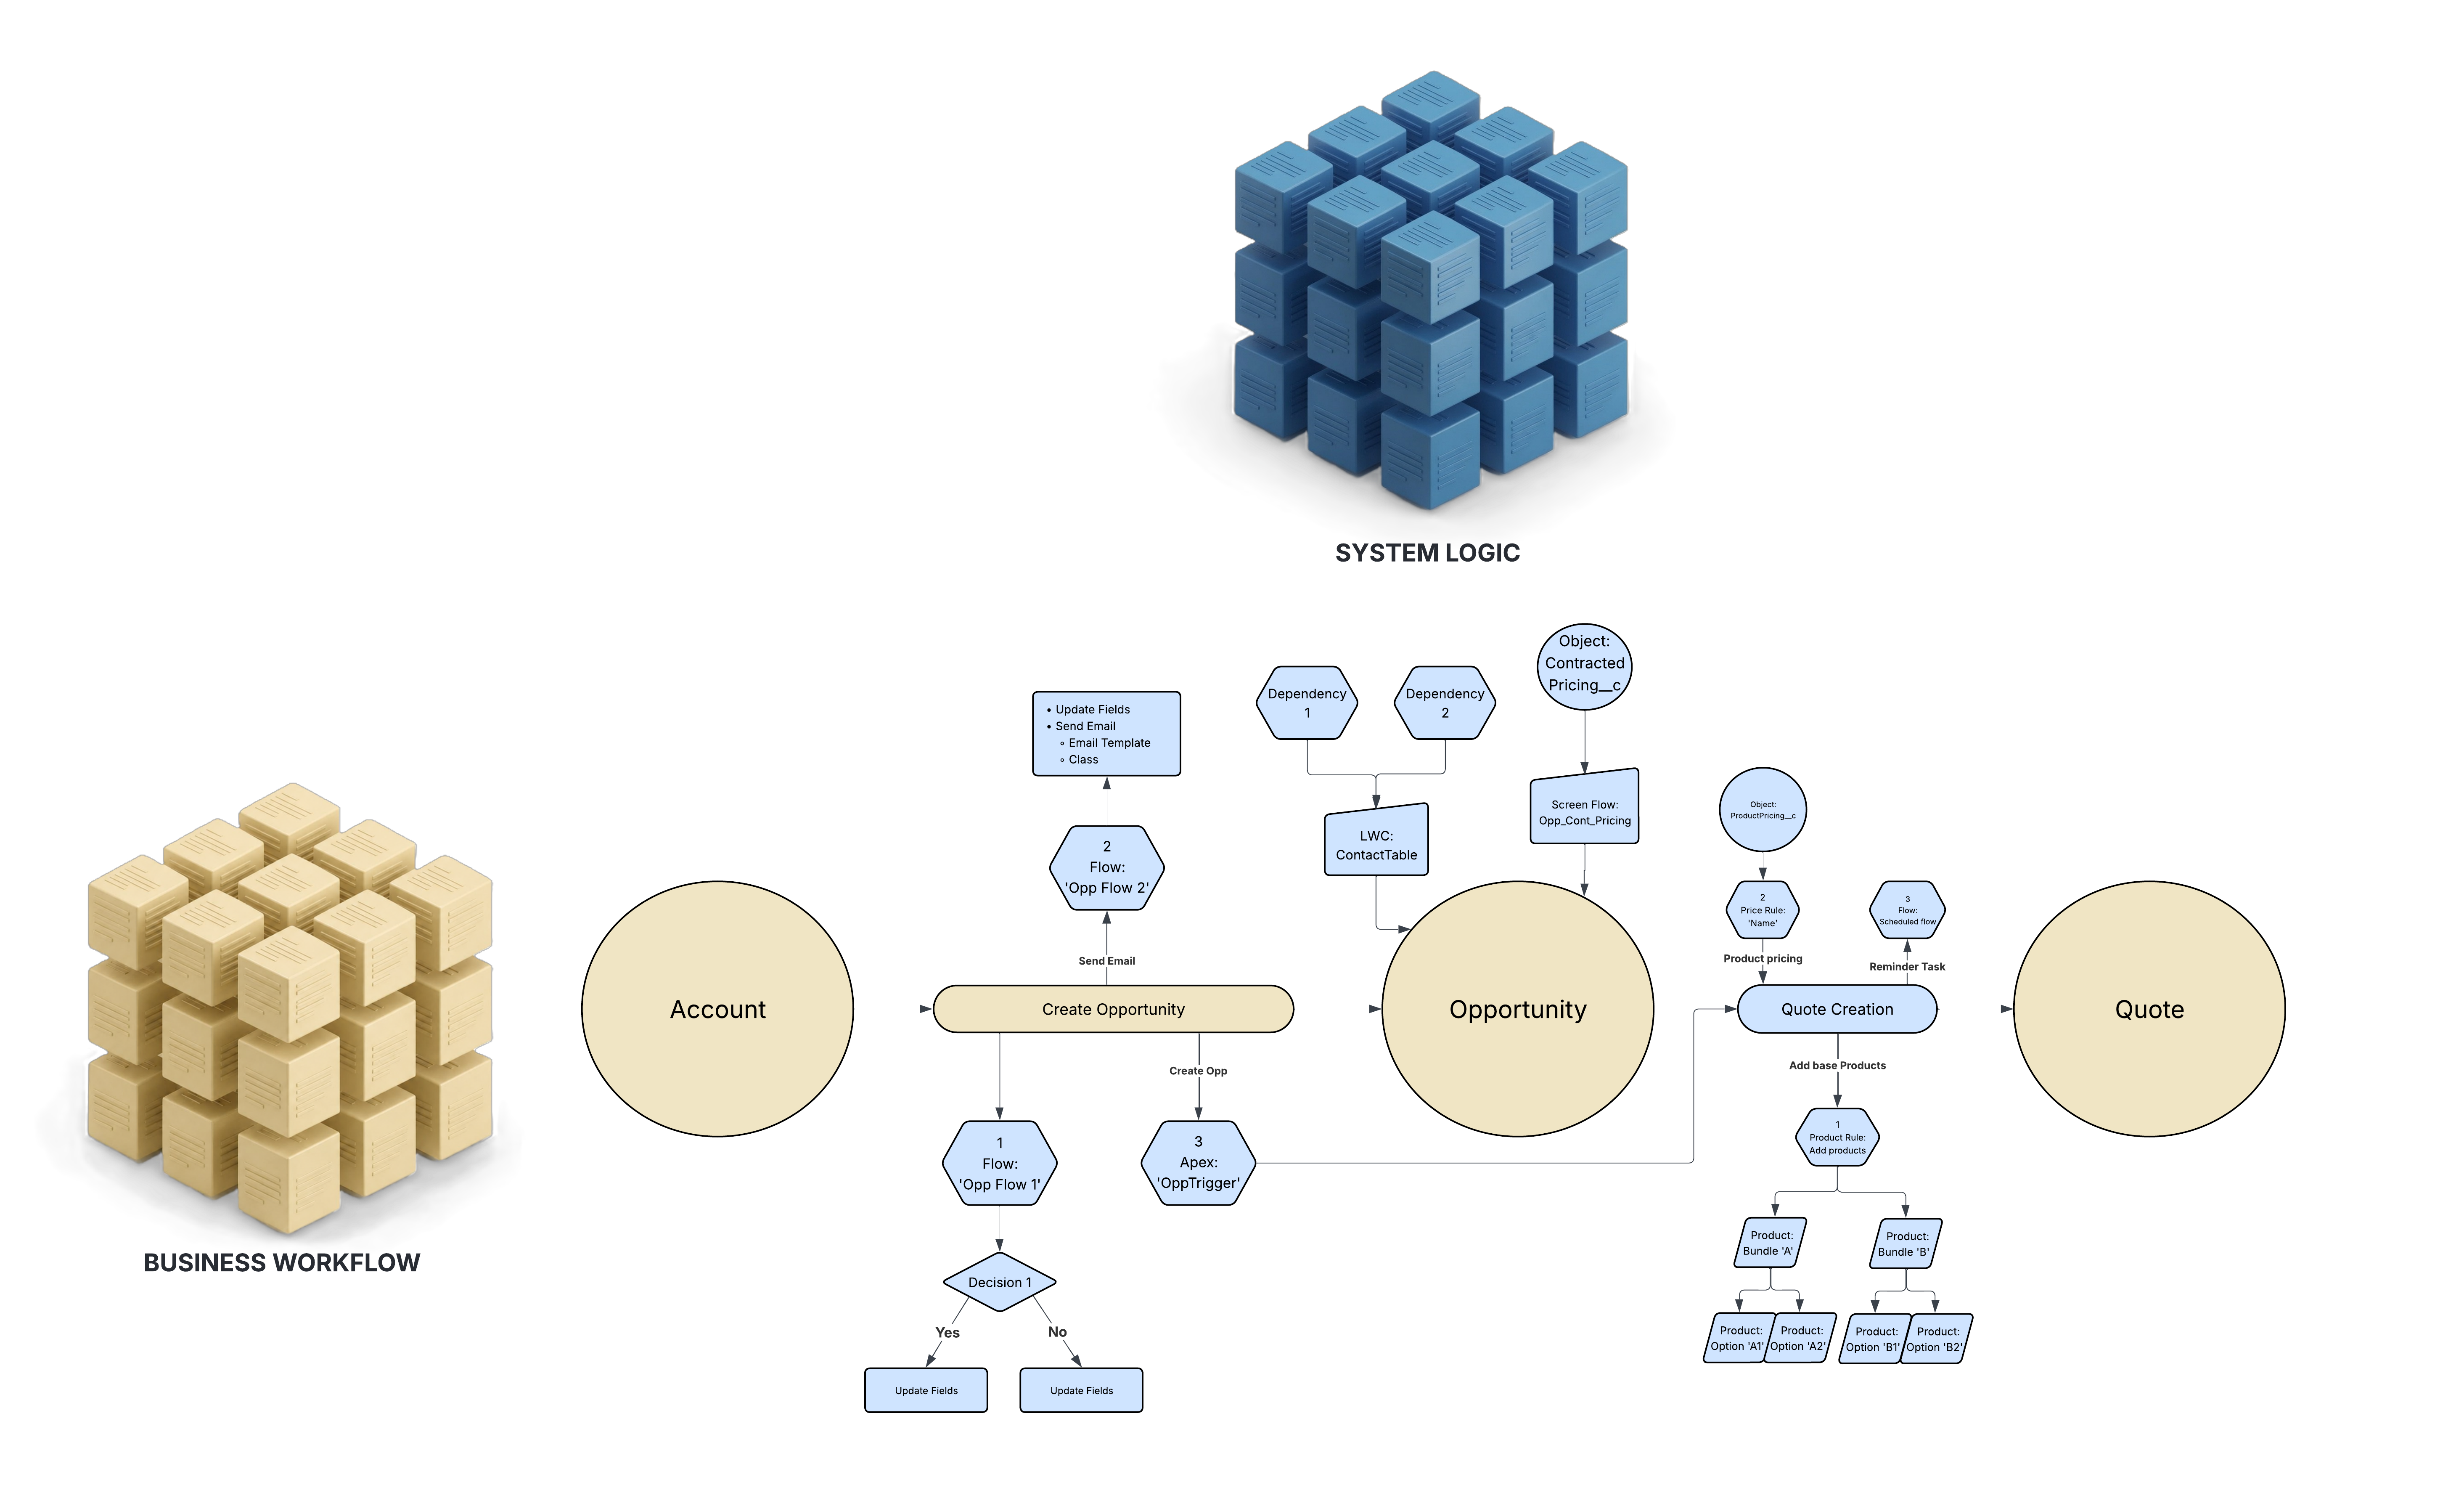
Generic B2B sales-to-fulfillment flow. The labels on the arrows are the automation overlay — the Flows, Apex, and integrations driving each transition.
When new features land on a diagram of the existing system, scoping conversations happen against a shared picture. Stakeholders see exactly where the change touches and what depends on it.
Most rework comes from building the literal request without questioning whether it's the right request. A visible map makes the underlying intent legible — and the gap between intent and ask easy to close.
Engineers don't have to wait for a ticket to flag a fragile pattern. The map gives them a place to point at — and the org gets cleaner over time, not just when something breaks.
The first version of the map is built during a focused engagement: we walk the business process end-to-end with your team, inventory the automation in the org, and render it as a single diagram.
After that, the map is maintained as the org changes. Every Flow added, every integration rewired, every business-process shift updates the diagram before it goes live. It works best as part of an ongoing engagement — typically integrated into our Managed Services — so the artifact never falls behind.
Tell us about the process you're trying to make legible. We'll come back with a scoped plan for the first version of the map.